Extracting and Analyzing SAP Data with AWS Heroes
The business environment is rapidly changing, and companies need to stay up to date in their data analysis and utilization. The SAP system contains a vast amount of valuable information, but accessing and analyzing it can be a challenge. However, with the help of Amazon Web Services (AWS) offerings, we can simplify the extraction of SAP data and data analysis. In this article, we will demonstrate how to use Amazon AppFlow, Athena, DataBrew, QuickSight, and S3 for SAP data analysis and explore their benefits.
Benefits of Analyzing SAP Data
The use of SAP systems is essential for many businesses in managing their business processes. However, due to the complexity of working with SAP systems, extracting and analyzing data can often be challenging. The benefits of analyzing SAP data include:
- Planning and Decision-Making: Analyzing SAP data enables companies to better understand their operations, serving as a foundation for future planning and decision-making.
- Improved Efficiency: Data analysis helps in enhancing and optimizing business processes, which can increase efficiency and reduce costs.
- Customer Service: Analyzing SAP data can aid in improving customer service by allowing for better customer evaluation and a deeper understanding of customer needs.
- Competitive Advantage: Data analysis can help gain a competitive edge in the market by enabling timely responses to new opportunities and challenges.
How to Begin Analyzing SAP Data with AWS
- Discovering SAP data using the OData layer: The SAP system’s OData layer allows for easy and structured access to data. Through the OData layer, you can readily select the data needed for analysis.
- Configuring Amazon AppFlow with SAP S/4: Amazon AppFlow makes it easy to configure a connection with the SAP system and set up data transfer to the AWS environment.
- Running processes to export SAP data to Amazon S3: With Amazon AppFlow, you can easily execute processes to export SAP data to an Amazon S3 storage location. The data can be securely stored there and is ready for further analysis.
- Data preparation with AWS Glue DataBrew or Amazon Athena on the S3 dataset: AWS Glue DataBrew and Amazon Athena make it simple to prepare data for analysis. These services enable data cleansing, transformation, and preparation for analysis.
- Presenting sales orders on the Amazon QuickSight dashboard: Amazon QuickSight allows you to create interactive dashboards showcasing sales orders and analyses. This facilitates easy and rapid understanding of the data for business leaders and decision-makers.
Benefits of AWS Services for SAP Data Analysis
- Scalability: AWS offers scalable infrastructure, allowing for growth and flexibility in data analysis. Whether it’s for small or large enterprises, AWS can adapt to meet the demands.
- Security: AWS provides numerous security measures to protect data, including data encryption and access control.
- Cost-effectiveness: AWS enables data storage and analysis only in the areas where it’s truly needed, reducing costs.
- Integration: AWS offers a wide range of services that can easily integrate with the SAP system, facilitating the smooth flow and analysis of data.
Analyzing SAP data can be a complex process, but with AWS services, simplicity and efficiency can be significantly improved. With Amazon AppFlow, Athena, DataBrew, QuickSight, and S3, businesses can easily extract and analyze SAP data, harnessing the associated business advantages. The combined use of SAP and AWS represents the future of data analysis, enabling companies to make decisions faster and more efficiently.
Now, let’s take a look at how this works in a live environment
In an unconventional approach, we’ll start by presenting the end product, then delve into the architecture, and go through the services mentioned step-by-step. As the end product, you’ll see a dashboard that showcases sales orders from various perspectives.
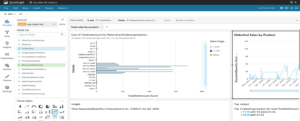
But let’s not get ahead of ourselves.
Architecture
We have already described how this pipeline is built, but I think a visual architecture is easier to understand and remember.

The architecture clearly shows that Amazon Appflow is used to extract the data, which is supported by the SAP OData layer to access and export SAP data. The raw data is dumped to an S3 bucket. This data is now easily readable even by using a quick query to look into it directly from the S3 bucket.
In this post we will present 2 options to transform and prepare the data for the final product (Option 1, Option2)
Since the two solutions use different services, which implies the specificity of the services, I will just mention the differences for now and touch on the topic in more depth later.
Option 1 uses AWS Glue DataBrew, which is a great ’drag and drop’ solution for transforming and integrating data, where data is scanned from the S3 file already dumped, the appropriate transformations are made and the data is dumped into another Bucket or Folder from which Dashboards can be created.
Option 2 uses Amazon Athena, for this solution basic SQL programming skills are essential as Athena uses code based queries to create tables and perform transformations. Athena uses the on-the-fly methodology which means that it does not “save” tables in Amazon S3 as a traditional database system does. What Athena actually does is work with the metadata of the data tables, which contains descriptions of the data, such as column names, types, and where the data is stored in Amazon S3.
And finally, we use Amazon QuickSight for visualization.This sevice uses basic Machine Learning modules to easily run ML-based prediction, anomaly detection.
In broad terms this would be the architecture, we will describe the architecture and setup of the pipeline in more detail in the next section.
Step-by-Step
Now we’ll show you how the pipeline is built as a service, give you insights on how to configure SAP with Amazon Appflow, how the different transformation services work, and how easy it is to use QuickSight.
- S3
Amazon S3 bucket is the oldest AWS service that can be used globally, all you have to do is give the bucket a name and set the region you want to use.

- Amazon Appflow
Amazon AppFlow is a service within the Amazon Web Services (AWS) cloud platform that enables the automatic movement and synchronisation of data between different applications and services. With Amazon AppFlow, you can easily integrate data from and to AWS and other external applications such as Salesforce, Slack, Google Analytics, and many others.
Within the service, we first need to create a connection to SAP with the appropriate credentials, using the SAP OData layer (Appflow can handle multiple connections, for example GitHub, Salesforce or even Instagram).

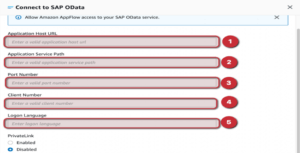
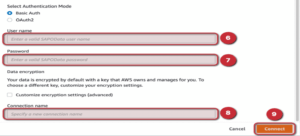
If the connection has been tested and everything has been entered correctly, you will be given the green light to build the “Flow”.
Once we have gone through the usual steps like name and tags, we then move on to the “what” and “where”. It means that we specify the connection to connect to the SAP and get the data we want from there. This requires somel SAP knowledge of what is stored where in the system.

This part answered the question ’what’: what is the table I need from SAP?
And for the question ’where’: where do we want to dump this data?Iin this post we are dumping the file(s) into the bucket we have already created.

That’s most of the Flow is done already, all you have to do is set when it should run, which can be a one-off manual run or you can set an event or time for it to run. We chose to run it once.

In addition to this, once we know what we want, we have the option to choose which columns we want to fill in the S3 Bucket. So we have which table and we can decide which columns we want to bring within Flow. (This can raise a number of questions about what data we need, what methodology we are following, and whether the need will change later). We prefer ETL flow for this reason we will load everything into S3 and do transformations later within AWS.

When setting the partition and aggregation, we pay attention to the key according to which the process should build the folder structure and the way it should assemble the records.

I have taken the data from two tables for the dashboard SalesOrder and SalesOrderItem which means that we need to create 2 flows (but using the same connection) and see 2 files in S3-bucket after a successful run.
In the following we will cover the transformation and integration process using AWS Glue DataBrew as well as Amazon Athena. Both options are easy and fast, personally I prefer “on-the-fly” methodology as explained earlier i.e. Athena solution and prefer to write transformations in code.
- AWS Glue DataBrew – Option 1
AWS Glue DataBrew is a fully managed, visual data cleansing and transformation service. It makes it easy to clean and transform data without writing code. It is very useful when data preparation, cleaning and transformation are the primary tasks. For example, it can be useful in ETL (Extract, Transform, Load) processes.
The way DataBrew works is that we use the “Dataset” to specify the basis of what format and where the source file is located, then create a “Project” to put together the transformations we want to run. In the “Recipe” we can always check what transformations have been run in that project. Finally, we create a “Job” to specify where and in what format to load the transformed files.
The first step is to create a dataset that specifies the format of the files in the S3 bucket. I searched within Amazon S3 for the bucket name and the file we want to transform and set the file format. (As mentioned, we will be working with 2 datasets for the visualization, so we need to do this twice for a dataset we can use for one file.)
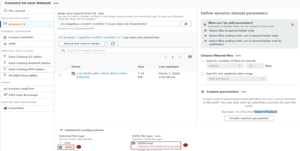
The main part is to create the Project and define the transformations. First we need to select the dataset we have already created and what we want to work with. In the Sampling part we can specify how many rows we want to work with and how to pick the rows.


And in the Permission section, if there is no Role for the DataBrew, we just create a new one with an ID suffix.

We’ve created our first DataBrew Project, and if everything was done right, it will launch the ’drag and drop’ transformation interface, which is really easy to use, with clear instructions and good visualizations of each step. As a next step, we would like to show you just 1 example (out of numerous data transformation and cleaning steps) to demonstrate the extreme ease of use of AWS Glue DataBrew.
The aim is tojoin two tables, for that we need a base table on which we created the Project, we also need a table to join, we need what we want to join and how to join inner, left, right excluding.

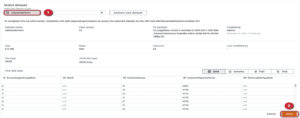
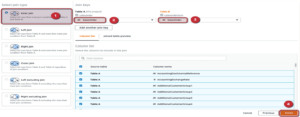
It’s as easy as that to switch the boards with a few clicks.
When you return to the Project, you can see the transformations you have created under the Recipe tab on the right hand side of the interface, where you can quickly follow the steps in order.

After the transformation steps, we create the Job to define where to put the finished file and in which format we can do this, by clicking on the “create job” icon within the Project. For this we can use the Role we have already created.


- Amazon Athena – Option 2
Amazon Athena is an interactive query service that allows you to run SQL queries on stored data without first loading it into a database. You can store your data in Amazon S3 and then use Athena to easily query that data. Useful when you want to quickly run queries on existing data.
Within Athena we use a simple query editor. When we first use Athena, we need to set up where tables and files are dropped. We simply need to specify which bucket to dump the files to. Athena will handle the file structure by year/month/day based on the queries.


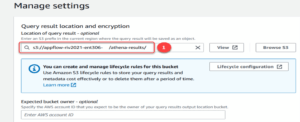
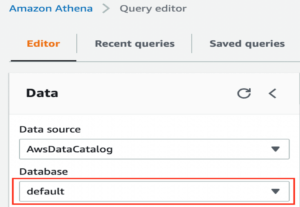
The default settings taken here are AWSDataCatalog and the default database. If the default database is not visible then a query needs to be run to create it and then refresh the page and it will be visible.
![]()
To solve this, we created two tables and a view, so we just have to run them inside Athena and then we can configure them with QucikSight. Here, we would like to describe one of the 3 queries in more detail.
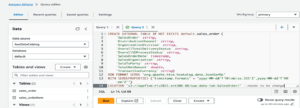
- Configuration for Amazon QuickSight
We decided to put the configuration section in a separate section since it matters which solution is used in the previous option1/option2.
There are different configurations associated with each of the cases because as described before, the DataBrew solution dumps the data into an S3 bucket, so QuckSight extracts the data directly from the bucket for visualization, whereas the other solution using on-the-fly, extracts the data via Athena for the dashboard.
- Amazon S3 — Amazon Quicksight configuration
For this configuration, before doing anything in AWS, we need to create a local “_manifest.txt” file, this file must contain the location of the S3 bucket, more precisely the folder created with DataBrew, and the format. This will be used later on.

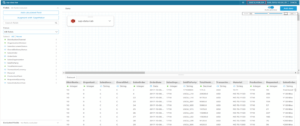
After creating a user within Amazon QuickSight and specifying the bucket where our files are located, we will be taken directly to the user interface. There we can immediately start creating the dataset we want to visualize from S3.
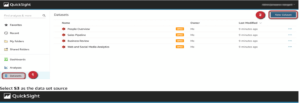
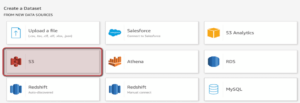
If we have selected S3, we will need to specify the path to the file “_manifest.txt” in the following and use it to access the file(s). If we have entered the file correctly, we can click on “save and publish” in the top right corner to create the dataset and start the visualization.
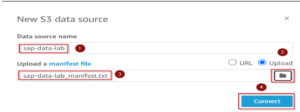
- Amazon Athena — Amazon Quicksight
After creating a user within Amazon QuickSight and specifying the bucket where our files are located, we will be taken directly to the user interface. There we can immediately start creating the dataset we want to visualize from S3.
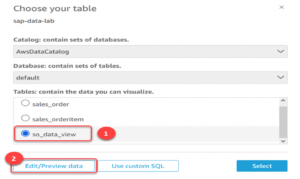
Now in this case we choose Athena instead of S3, we give the new datasource a name.
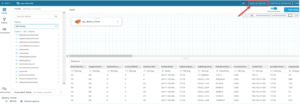
We select the table we want to visualize by specifying the same parameters we specified in Athena AWSDataCatalog and the default database. Clicking on Edit/Preview will take us to the page where we can further format the data, but we don’t need to do that now as we have transformed the data well. We can then click on “save and publish” in the top right corner to create the dataset and start the visualisation work.
- Amazon QuickSight
Now that we have configured the dataset with Amazon Quicksight, we can start the visualization part.
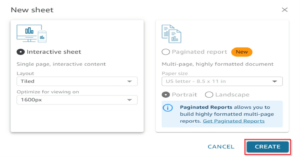
First, we click on the “Analyses” tab to create a new analysis, select the dataset we want to use and click on the “Use in analysis” icon and create an “Interactive sheet”.


Now we would like to show you some of the things we can do on Amazon QuickSight. As for now, just a basic bar chart and a repertoire of quick visualizations.
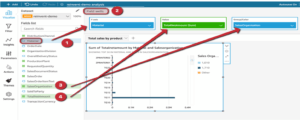
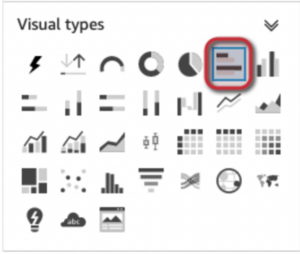
We have not explained these in more detail because they are basic solutions for data visualisation. What is a bit more interesting is the presentation of “Insight” based on Machine Learning. Amazon QuickSight includes prediction and anomaly detection that is based on ML.
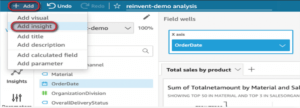
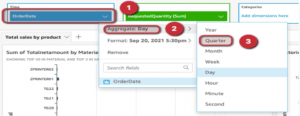
This service is easily accessible within “Insight” and can then be run with the appropriate parameters to get the desired result. In the following we can see how to have a Forecast using the OrderDate and RequestQuantity (Sum) columns, but first – because of the Forecast -, the OrderDate aggregation has to be changed from daily to quarterly.

The end result looks like this.

Amazon QuickSight also offers various “Insights” that can be quickly and easily integrated into the dashboard.
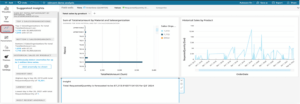
All we have to do is “Publish” our dashboard, which requires us to enter a name. Then we can share our dashboard with other users, groups, email addresses.

Summary
SAP data analysis with Amazon Web Services (AWS) enables companies to easily access and exploit valuable information. AWS services such as Amazon AppFlow, Athena, Databrew, QuickSight and S3 help simplify the extraction and analysis of SAP data. The benefits include better planning and decision-making, increased efficiency, improved customer service and a competitive advantage. AWS offers scalability, security, cost-effectiveness and integration, enabling efficient data analysis. SAP data analytics and AWS work together to help companies make faster, more efficient decisions and realize business opportunities.
